Efficiency Results
of European countries’ SARS-CoV-2 policies
Factor importance
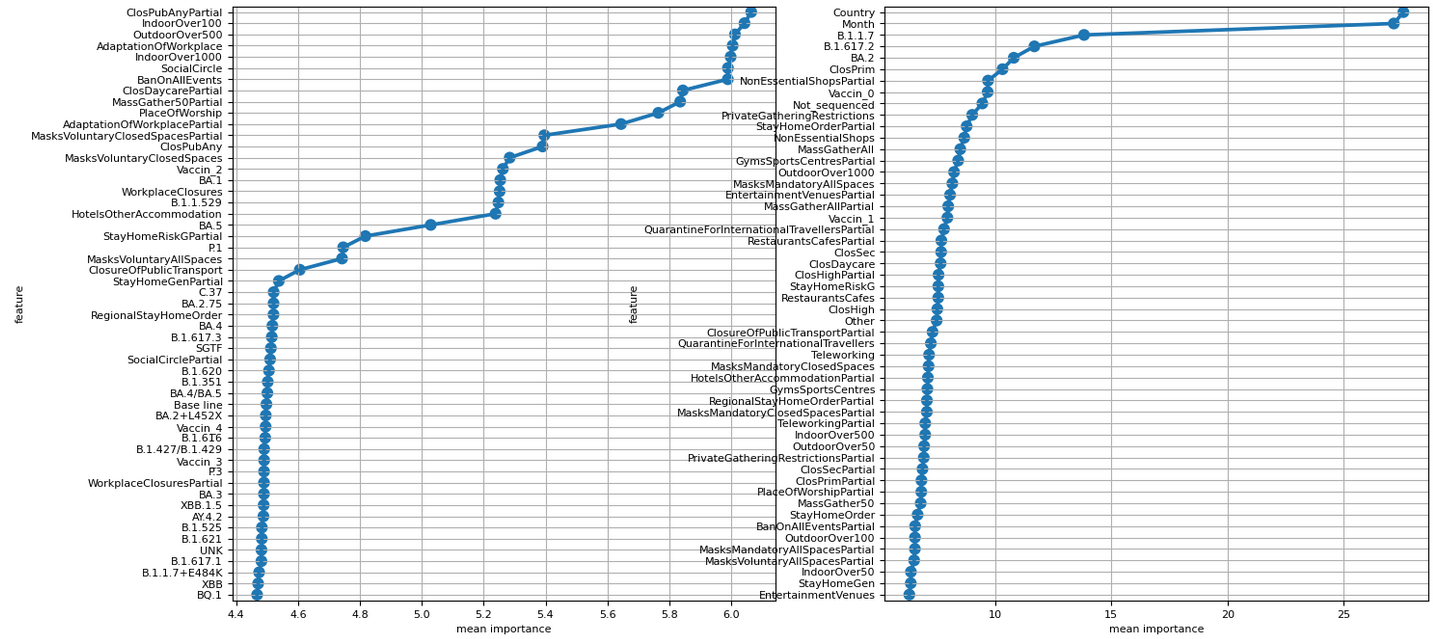
To shed light on the relative importance of each relevant input feature selected from a rich set of input factors (consisting of 66 government measures, virus variant distributions of 31 virus types, the vaccinated population percentages by the first five doses as well as the reported daily infections in each country) on the pandemic growth , we applied well-known explainable machine learning algorithms. Due to the high length of the feature numbers, the resulted importance of variables is presented on two side-by-side panels. The right panel is indeed the continuation of the left hand side one. The features at the bottom of the left hand side panel can be interpreted as the ones with lower importance values and the features at the top levels of the right hand side panel are the ones with the highest importance values. The Base line, which represents the zero importance line, lays around the bottom of the left hand side panel between some not frequently observed virus variants i.e. BA.2+L452X and BA.4/BA.5.
Marginal effects
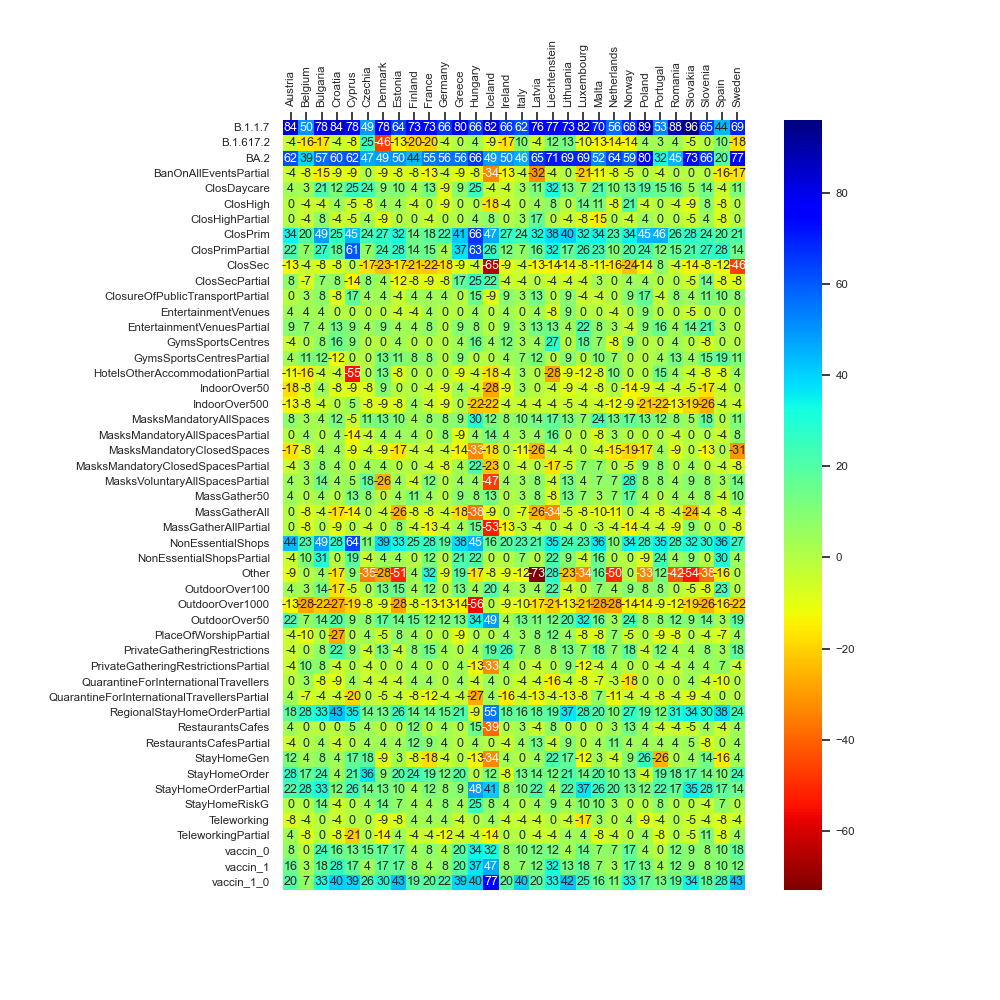
By means of relevant AI algorithms we aimed at understanding two distinct counterfactual scenarios, in which one selected input factor from a rich set of input factors (consisting of 66 government measures, virus variant distributions of 31 virus types, the vaccinated population percentages by the first five doses as well as the reported daily infections in each country) could be turned to be 1 (representing its activation within all days in the data of a country between 2020 and 2022) or be turned to zero (representing its inactivation within all days in the data of a country between 2020 and 2022). We do this procedure country-wise over the entire existing data of each of the thirty countries’ data sets. For each explanatory factor and each country, we then subtract the predicted value related to the counterfactual inactivation of that factor (representing the predicted monthly reproduction rate by setting that feature to zero) from the predicted value related to the counterfactual activation of that feature (representing the predicted monthly reproduction rate by setting that feature to one). If the subtracted value is greater than zero, then the average predicted reproduction rate will be lower under the counterfactual scenario of the values of that factor being active on all days of the pandemic time span in the corresponding country. Analogously, negative subtracted values indicate greater predicted reproduction numbers under the counterfactual scenario of the values of that factor being active on all days of the pandemic time span in the corresponding country.The depicted values on the plot express average gains measured in terms of alteration of reproduction values to contain the pandemic growth, if one feature is active in comparison with the circumstance of that feature being non-active.
Applied methods
Information on the methods applied in this research can be found here.


