From COVID data to
recommendations
Examples of visualisation approaches
Motivation and Objectives
Publically available COVID-19 available from various different sources, in different states of aggregation and in different formats.This makes it difficult to find the right data representation without any subsatial analyses, and furthermore hard to impossible to find hidden information about dependencies, e.g. with respect to effectiveness of Anti-COVID measures.
The objective of this research is to provide means to make available data better accessible and comprehensible, in order to inform stakeholders and to support decision makers. As a solution, an integrated, interactive and web-based dahboard with visualisations of empirical data and result data generated by AI methods was developed, applying various appropriate means of presentation.
A dashboard for Exploration of public COVID-19 Data


Selection of parameters to be displayed, e.g.:
- Age group
- Time period
- Location (city or administrative district)
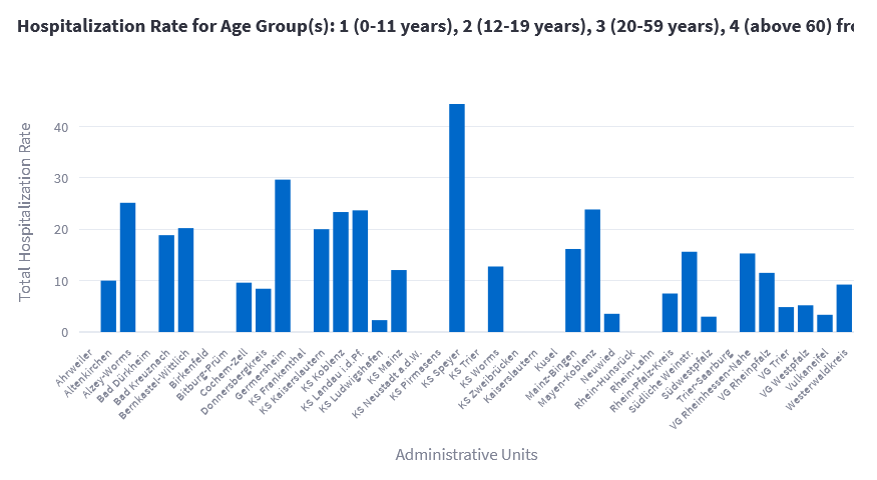
Display of diagrams for specified parameters, e.g.:
- Bar graphs for various numbers or rates for each city/district
- Timeline diagram for number of COVID cases
Integrated Visualisation of Data
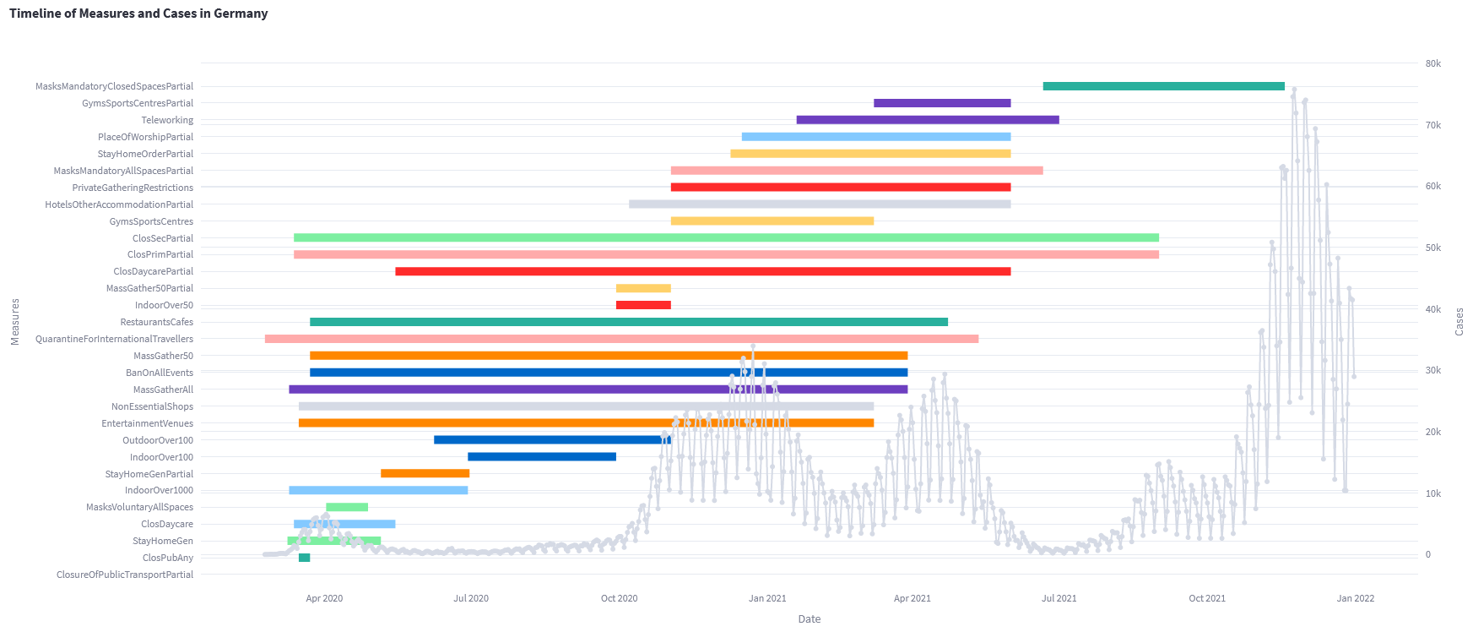
Combined visualisation of Anti-COVID Measures and Infection Numbers:
Chart with absolute number of COVID cases in Germany for specified period of time (2020-2021), together with non-pharmacological anti-COVID measures in force during this time period

Conclusions and Further Activities
Appropriate visualisations play a key role in making (even publically) available data accessible to decision makers and stakeholders. Integrated visualisation approaches allow (at least) qualitative analyses for dependencies between various different aspects, thereby disclosing complex and/or hidden information.
Further activities have been conducted in AI&COVID, which produced results to be incorporated in the dashboard in future research. Here are two example:
- Various approaches of statistical and AI-based data analysis systems, generating outcomes that can be displayed e.g. in similar charts as shown, and
- a prototype of a Case-based Reasoning (CBR) System can deliver recommendations for policies for given epidemic situations.
